Charts
Series, two Y axes, scatter with a real X, and a window that is an hour rather than a count.
A chart is the widget with the most moving parts, so it has its own page. It holds one or more series; each series is fed by a Push onto chart binding from a variable, and the chart decides what the axes mean and how many readings it keeps.
Series
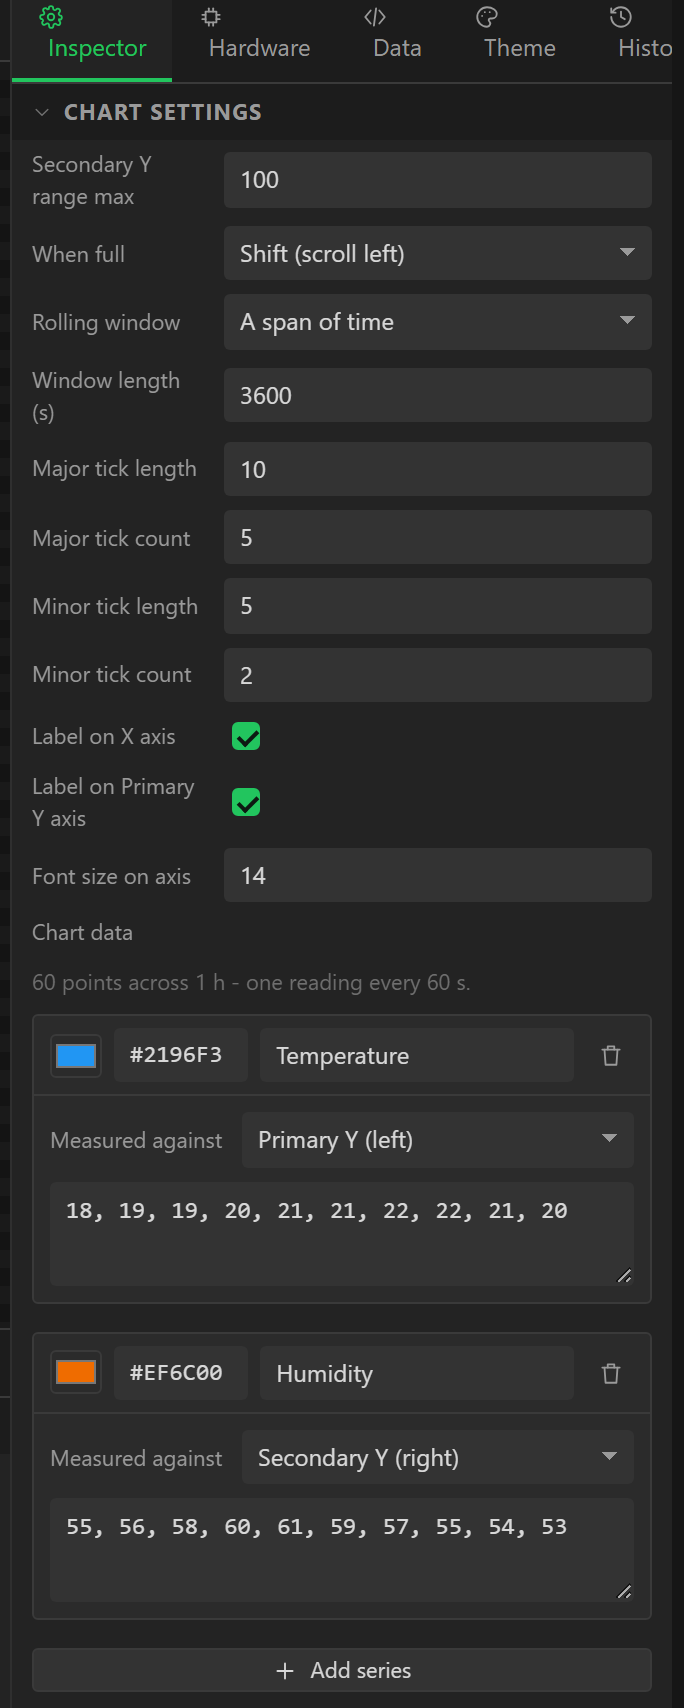
Under Chart data in the Inspector, each series has a name, a colour, a list of design-time values (what the canvas draws, and the initial points on the device), and - once a secondary axis exists - which axis it is measured against. A scatter chart's series also has a list of design-time X values. Add as many series as you have things to plot; the feed for each is a binding.
Feeding it
Select the chart, add a Data binding, choose the variable, set Drives to Push onto
chart and pick the Series. Every refresh in which the variable is due, its value is
appended with lv_chart_set_next_value(). A temperature line and a humidity line are
two bindings on one chart pointed at two series.
Two Y axes
Switch on Secondary Y axis and the chart gains a right-hand axis with its own range (Secondary Y range min / max), and each series gains the Measured against choice. That is what lets 0-50 °C sit beside 400-2000 ppm CO2 without one of them drawing as a flat line along the bottom. The canvas draws the second axis's labels on the right. The validator warns when a series is measured against a secondary axis the chart does not have.
Scatter and the X axis
A Scatter chart plots each point at an X as well as a Y. The X range is set on the chart (X range min / max), and X from names the variable every point takes its X from - one setting for the whole chart, because a chart has one X axis. Left empty, each reading keeps the X it already had and the series stacks on one column, which the validator warns about.
A time axis
Point X from at a variable reading a real-time clock - the DS3231's Unix time channel - and the scatter chart becomes a time axis. Two details make that work on a microcontroller:
- X values are stored relative to the first reading the chart received, so a ten-digit timestamp becomes seconds since the chart started. On LVGL 9 coordinates are 32-bit; on LVGL 8 they are 16-bit, which limits a time axis to about nine hours from the first point.
- The clock variable should be an Integer with no formula. A
floathas 24 bits of mantissa and rounds a unix timestamp to the nearest 128 seconds; the validator warns if a clock is plotted as a Float.
The rolling window
Rolling window is either The last N points - N is the chart's point count, and When full decides whether new points shift the old ones left or overwrite them circularly - or A span of time in seconds. With a time span, the firmware paces the pushes so the point count covers the span: an hour across 120 points is one reading every 30 seconds, whatever the refresh rate. The Inspector shows the resulting cadence under the setting, and the validator warns if it is faster than the refresh loop can deliver. On a scatter chart with a time axis the X range also rolls, so the last hour is always what is on screen.
Ticks and labels
Major and minor tick lengths and counts, whether the X and primary Y axes are labelled, and the
axis font size. On LVGL 8 these become lv_chart_set_axis_tick() calls, including a
set for the secondary axis when there is one; LVGL 9 removed that API in favour of the scale
widget, so on 9 the ticks are a canvas hint only.
Generated code, briefly
The screen file creates the chart, sets its type, point count, division lines, ranges (primary,
secondary and X where used), update mode and ticks, then adds each series on its axis and fills
in the design-time values. app_logic.cpp holds a per-chart pacing timer and, for a
scatter chart, the X origin; each push is one lv_chart_set_next_value() or, with an
X source, lv_chart_set_next_value2(), followed by
lv_chart_set_range() on the X axis when the window is a time span.